
Hi there,
After the first part of this topic, now is time to jump into the good stuff, the main thing here is to be notified every time something changes or goes «wrong».
Lets follow u the screenshots, from Setup, to Notifications setup, to finally monitor a couple servers and services.
As I said before, this is basic «alive» monitoring, not statistics and deep monitoring, there are other cool tools for that, the topic here is first line, quick and easy! lets go:
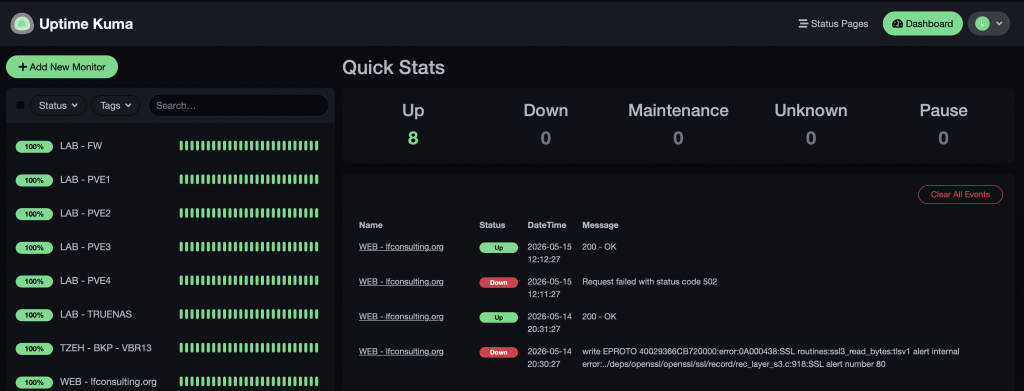
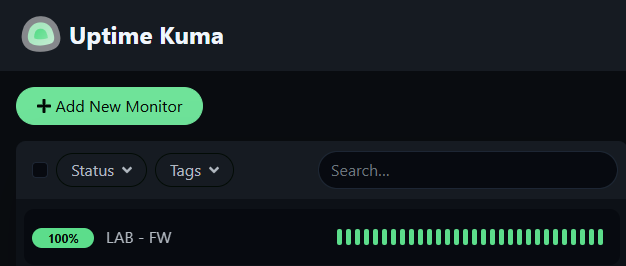
This is my Uptime-Kuma Dashboard, after install, lets go to Settings, click on your name up right, and click settings,
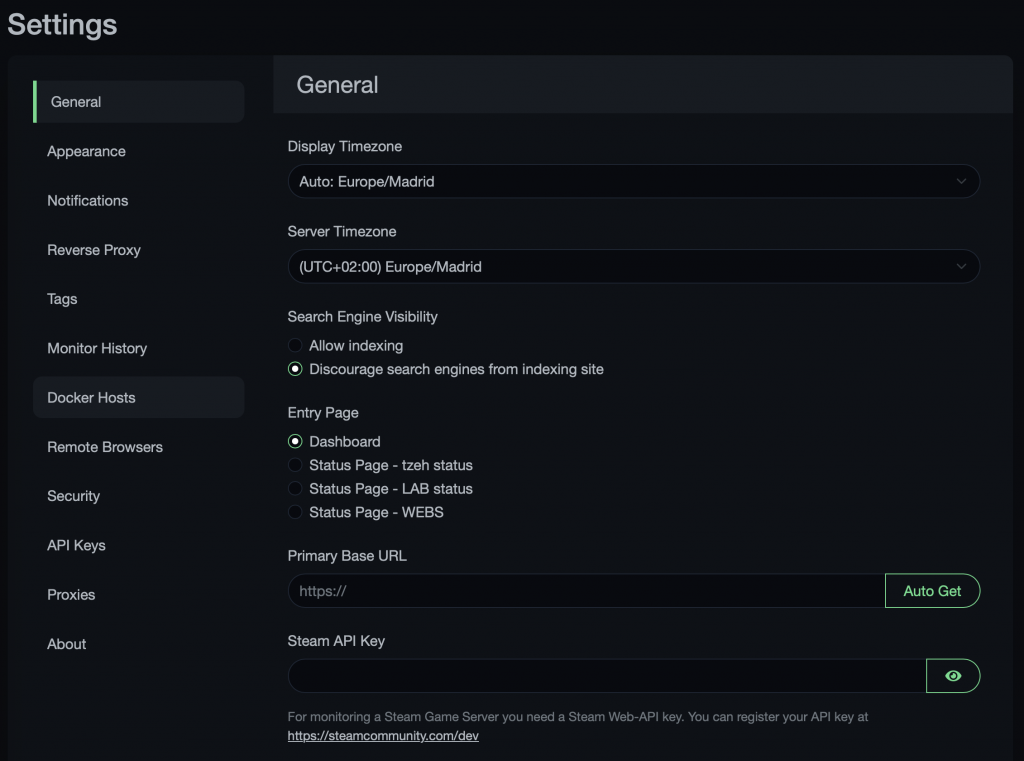
under Settings, we will find an easy and clear menu to config the tool, from appearance to proxy, etc.
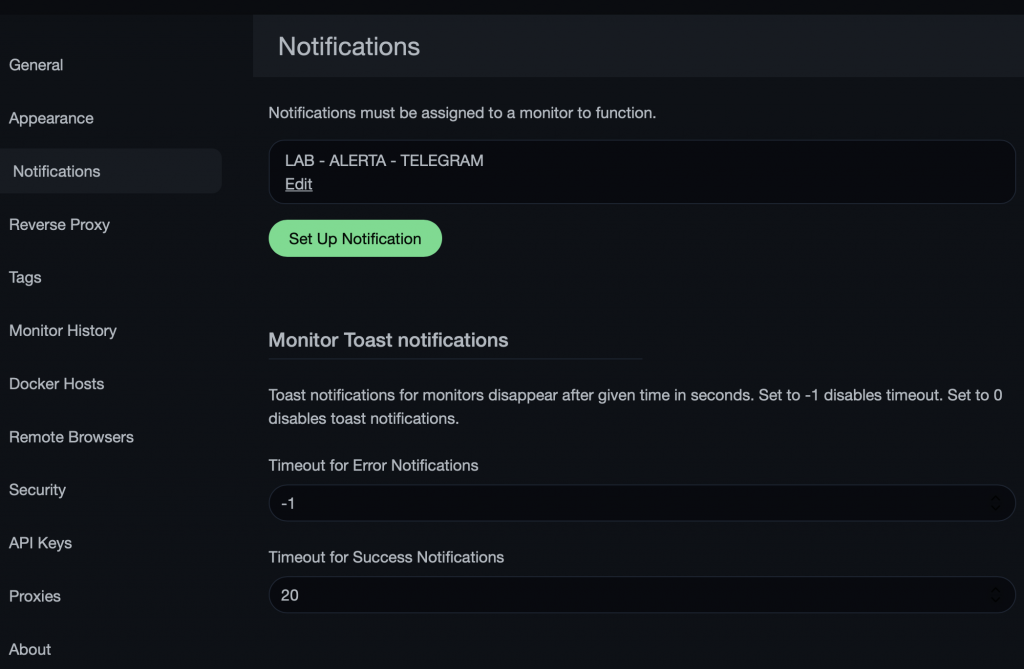
Im going to deep dive into the Notifications menu:
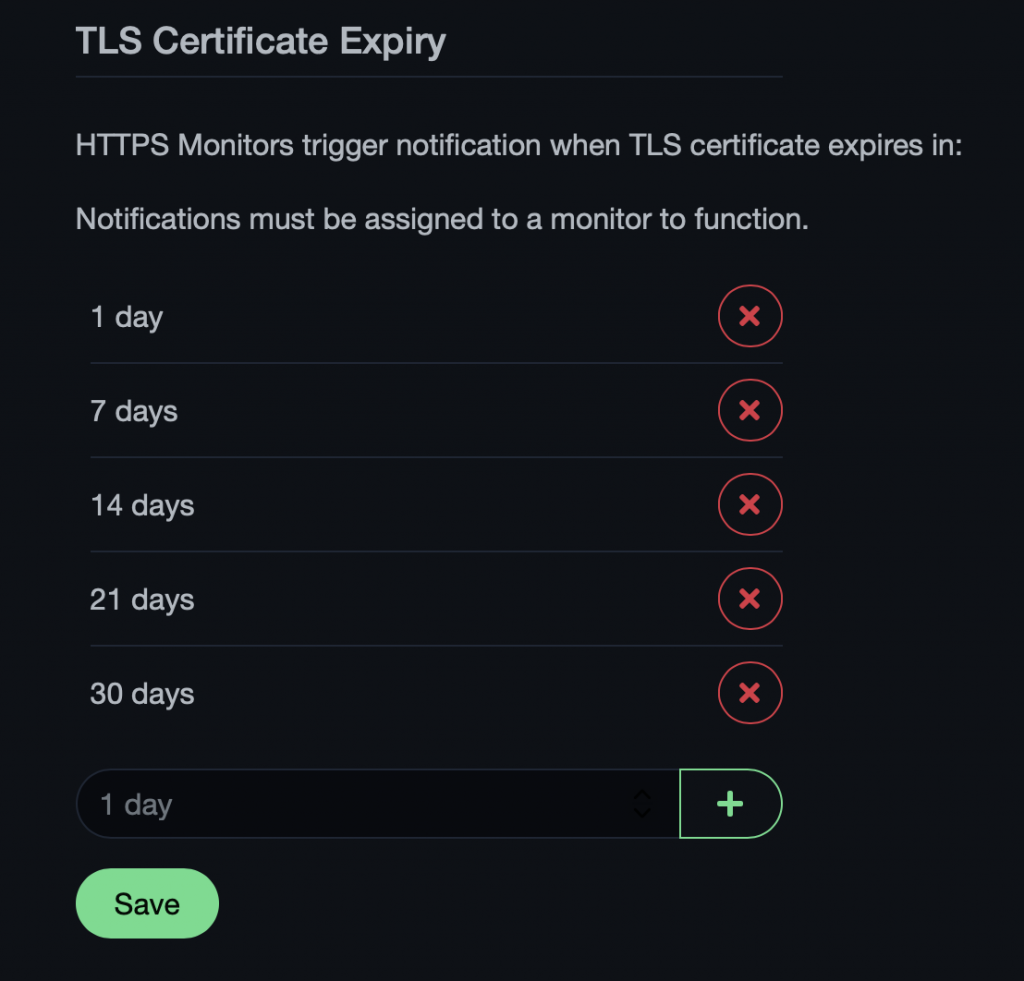
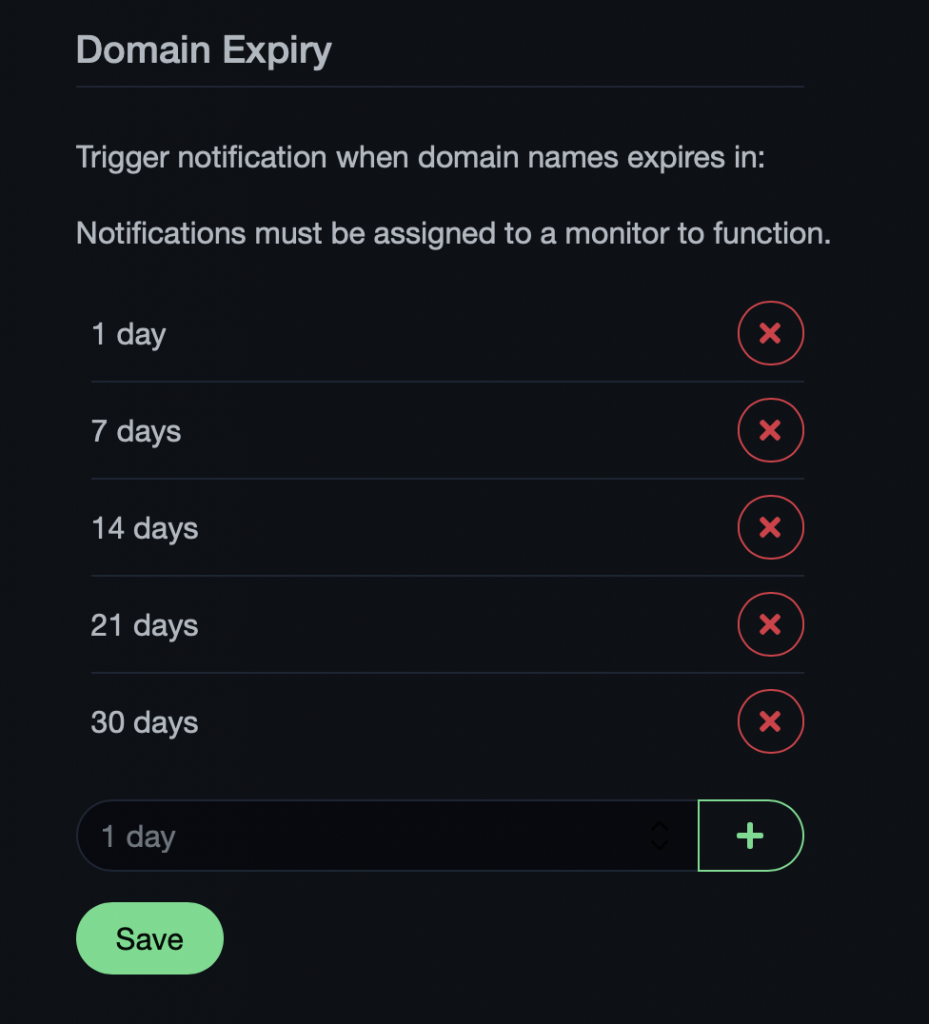
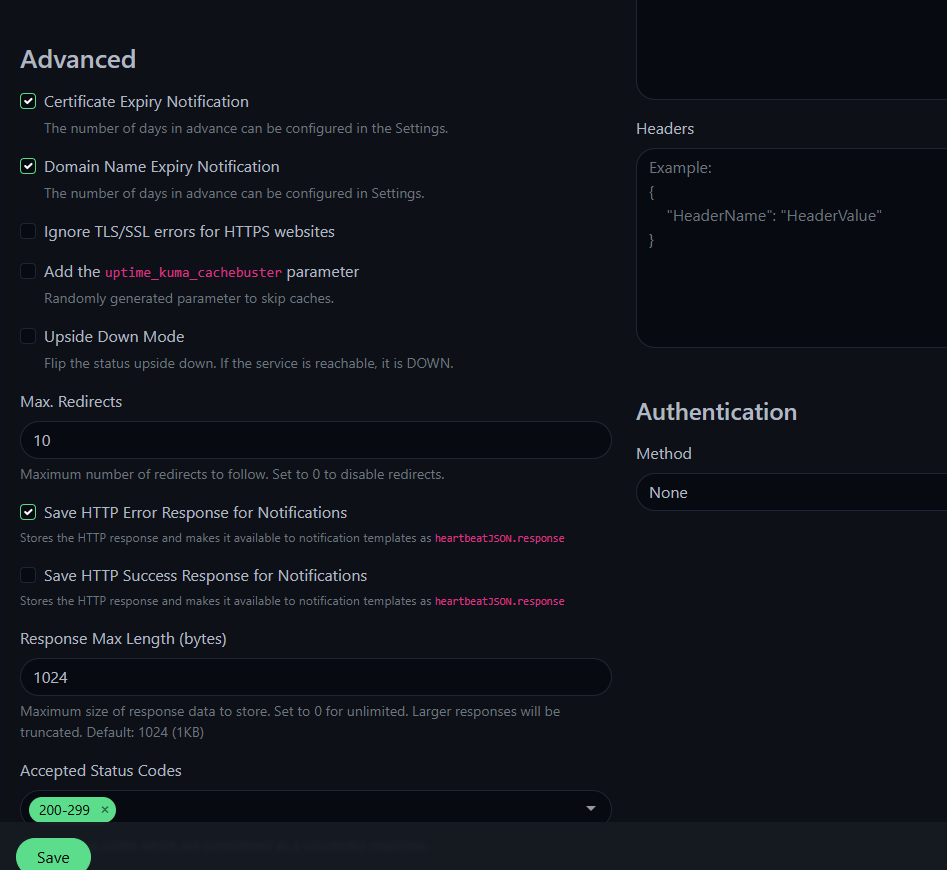
Now, let’s check it out, in the main menu, at the very bottom, we have the option to monitor TLS certificates and Domains expiracy, this is awesome! Im super happy Im not missing a cert renovation anymore, and no entries into my calendar, Uptime-Kuma notifies me in the time I program it.
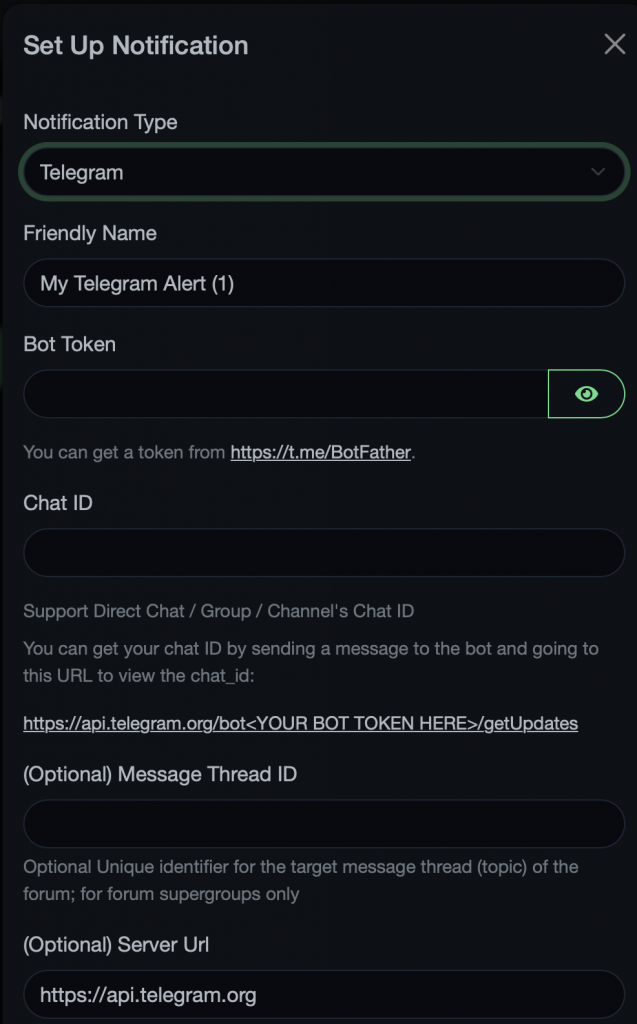
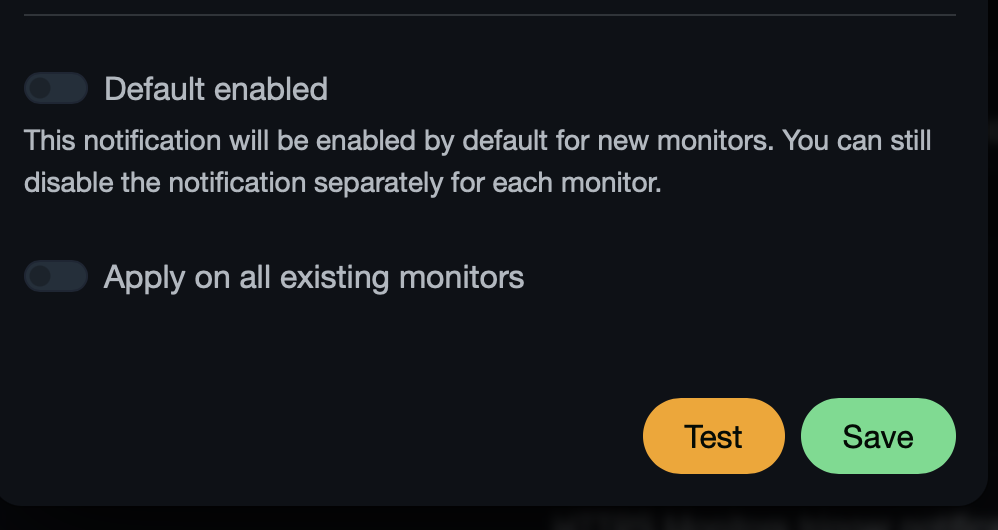
Now, lets click into Setup Notification, A menu will Appear showing you all the options we have, they are so many, Im using at the moment SMTP and Telegram:
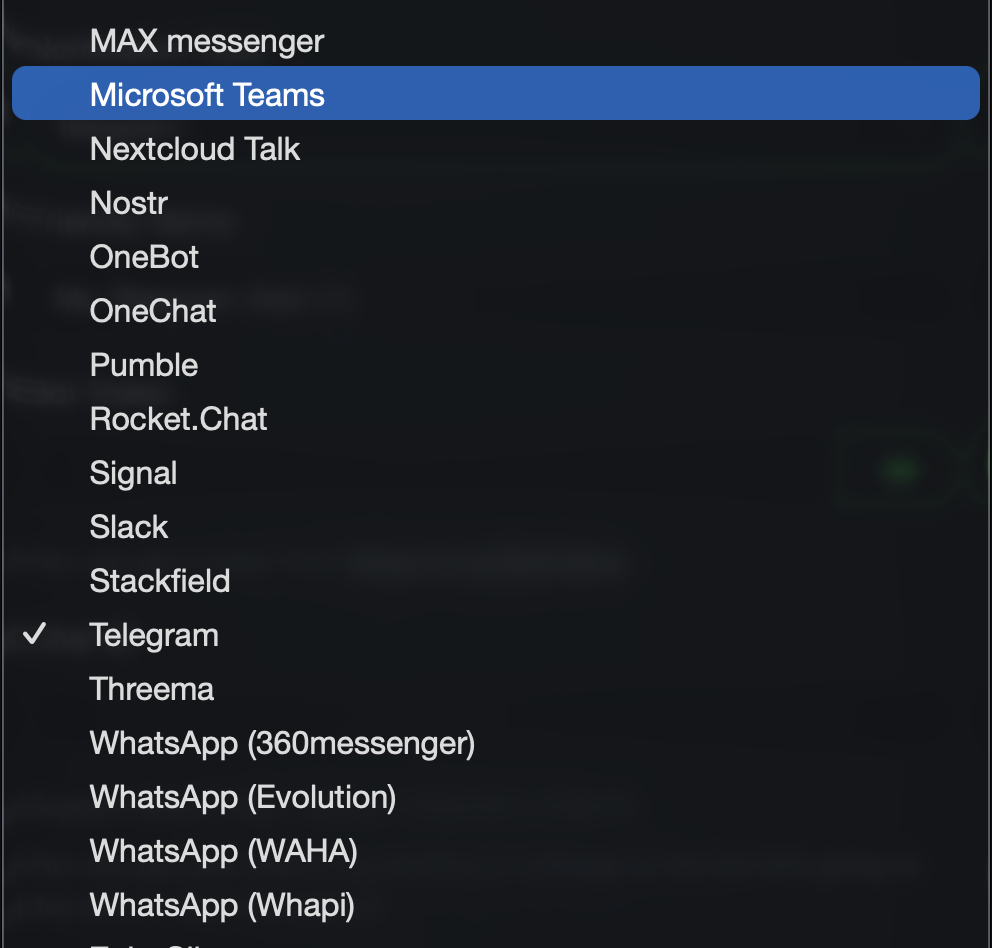
The is a huge list of services to choose from:
After setup, Just test and Setup, and you are set.
All right,
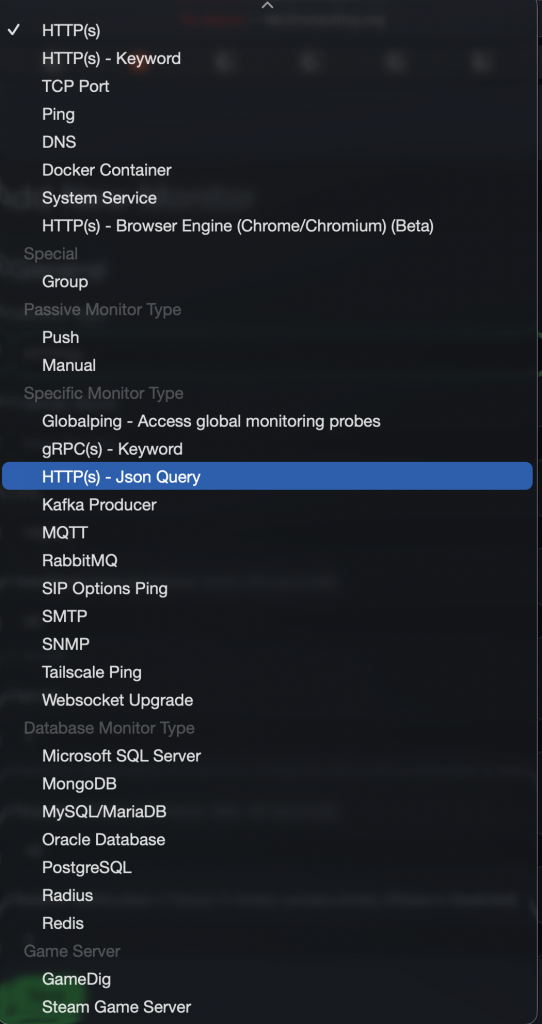
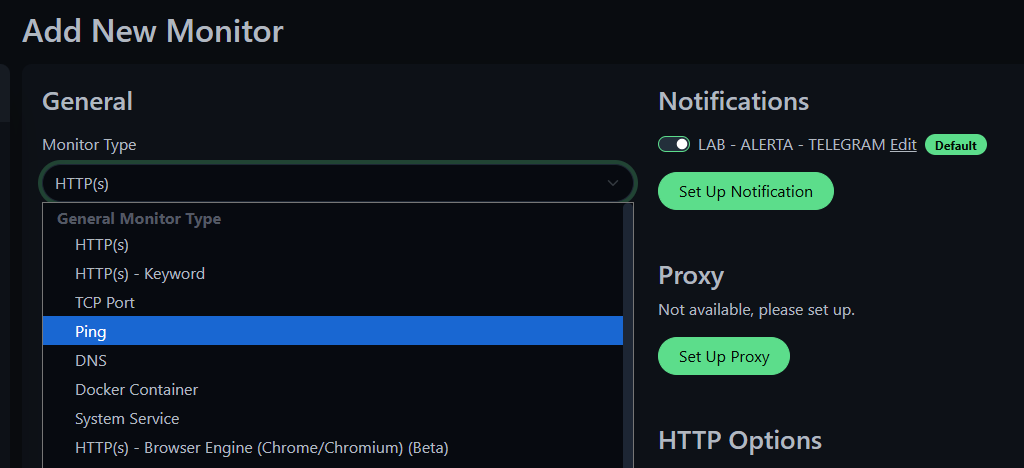
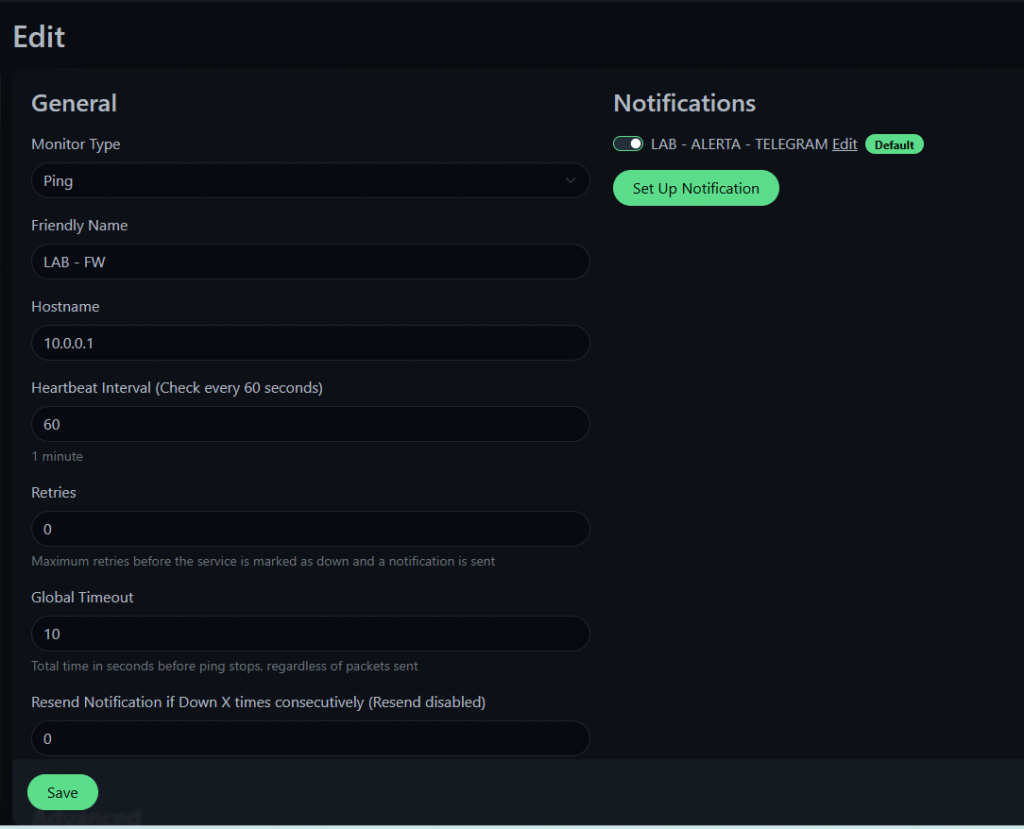
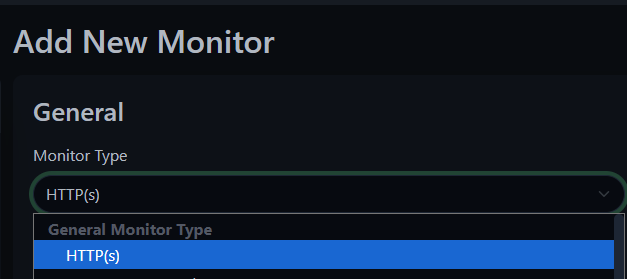
Now, moving on to the first monitoring item, lets configure a PING check for a vm inside the lab, and a web monitoring with the certificate expiraiton.
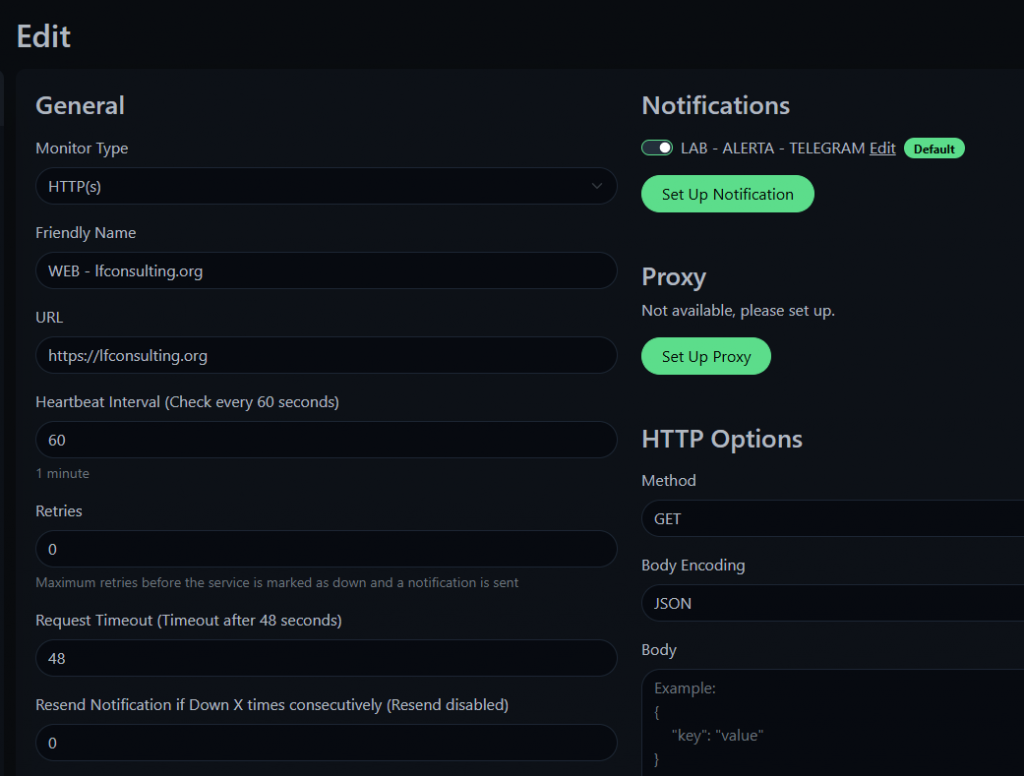
Now, lets monitor a website with the certificate expiration:
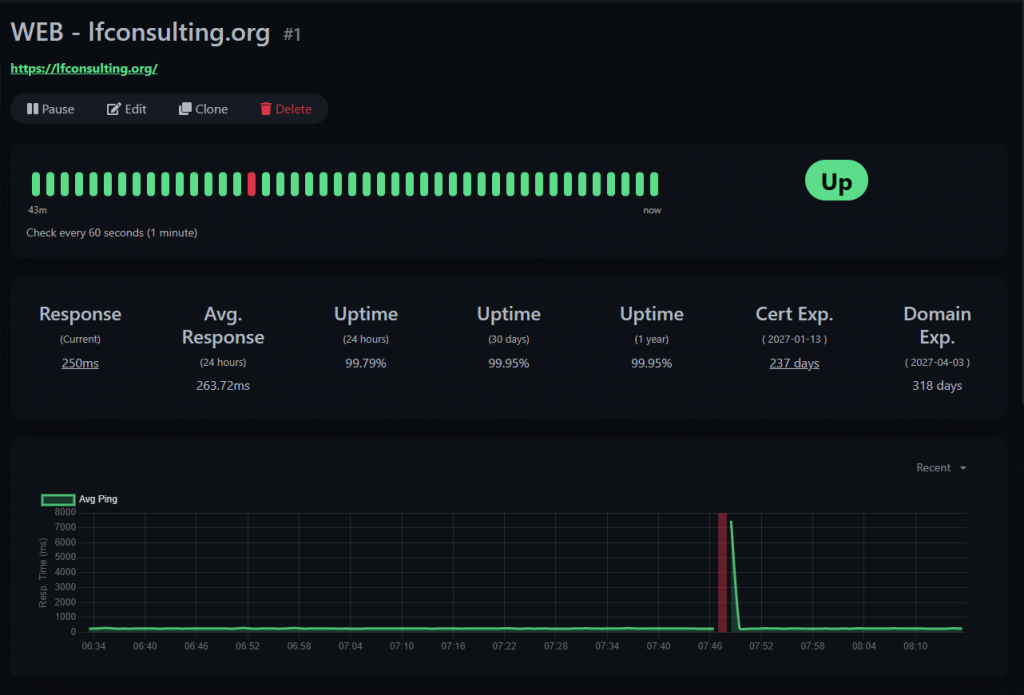
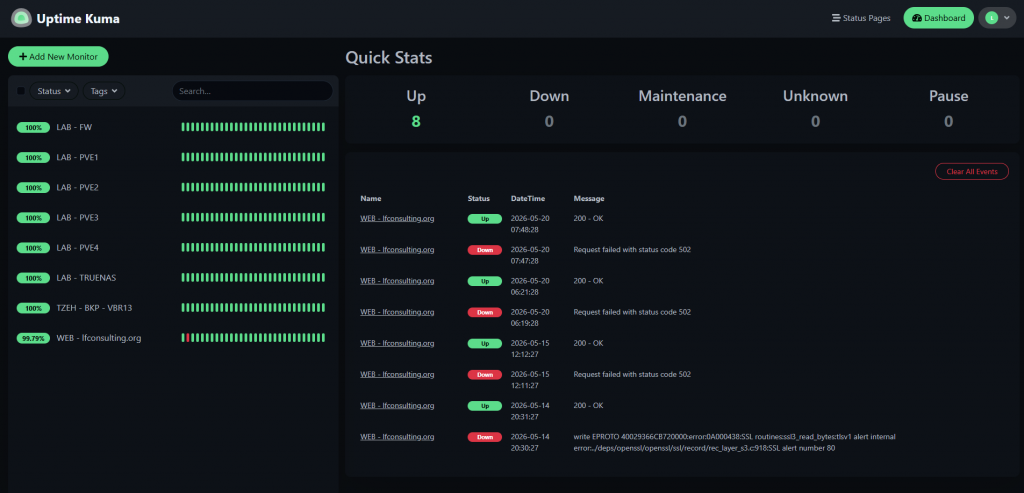
All set, now, this is how it looks the main page of my lab monitoring Uptime-Kuma instance:
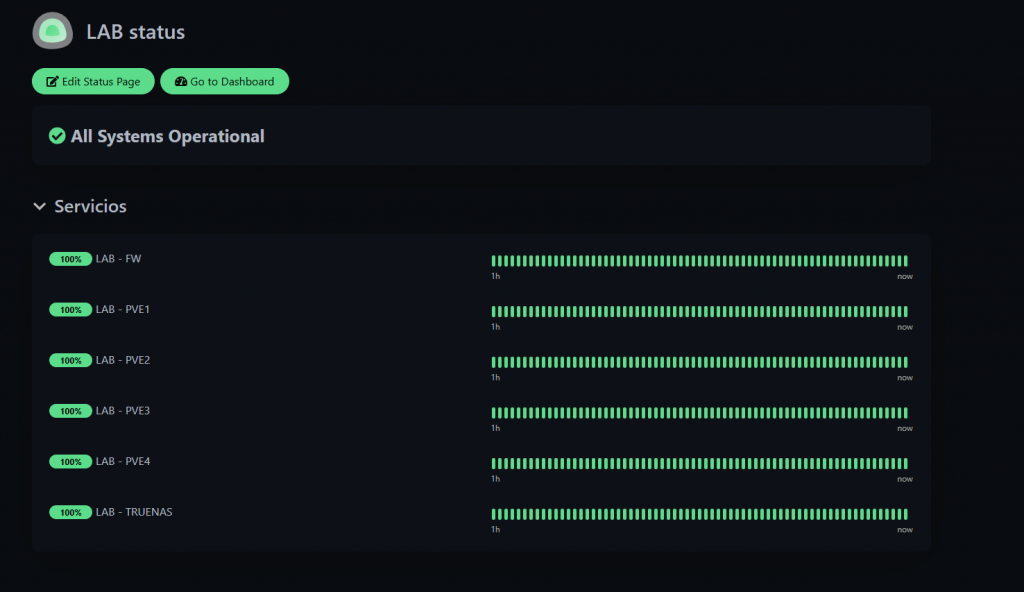
And this, is a view we can create for different accesses / services, so we can separate them by service, type, or «client», depending on your setup.
cheers.